Real-Time Energy Monitoring with ESP8266, PZEM-004T & Grafana
Table of Contents
Introduction
Understanding and managing energy consumption is crucial, whether for cost savings or environmental awareness. This project outlines the development of a comprehensive real-time energy monitoring system. Using an ESP8266 microcontroller and a PZEM-004T energy sensor, the system captures detailed electrical data, processes it through a containerized backend, and visualizes it on dynamic Grafana dashboards.
Project Goals
- Accurately measure key electrical parameters: Voltage, Current, Active Power, Accumulated Energy, Frequency, and Power Factor.
- Transmit sensor data wirelessly using an ESP8266.
- Develop a robust backend to receive, store, and process time-series data.
- Provide intuitive and interactive visualizations of energy consumption patterns.
- Utilize Docker for easy deployment and management of backend services.
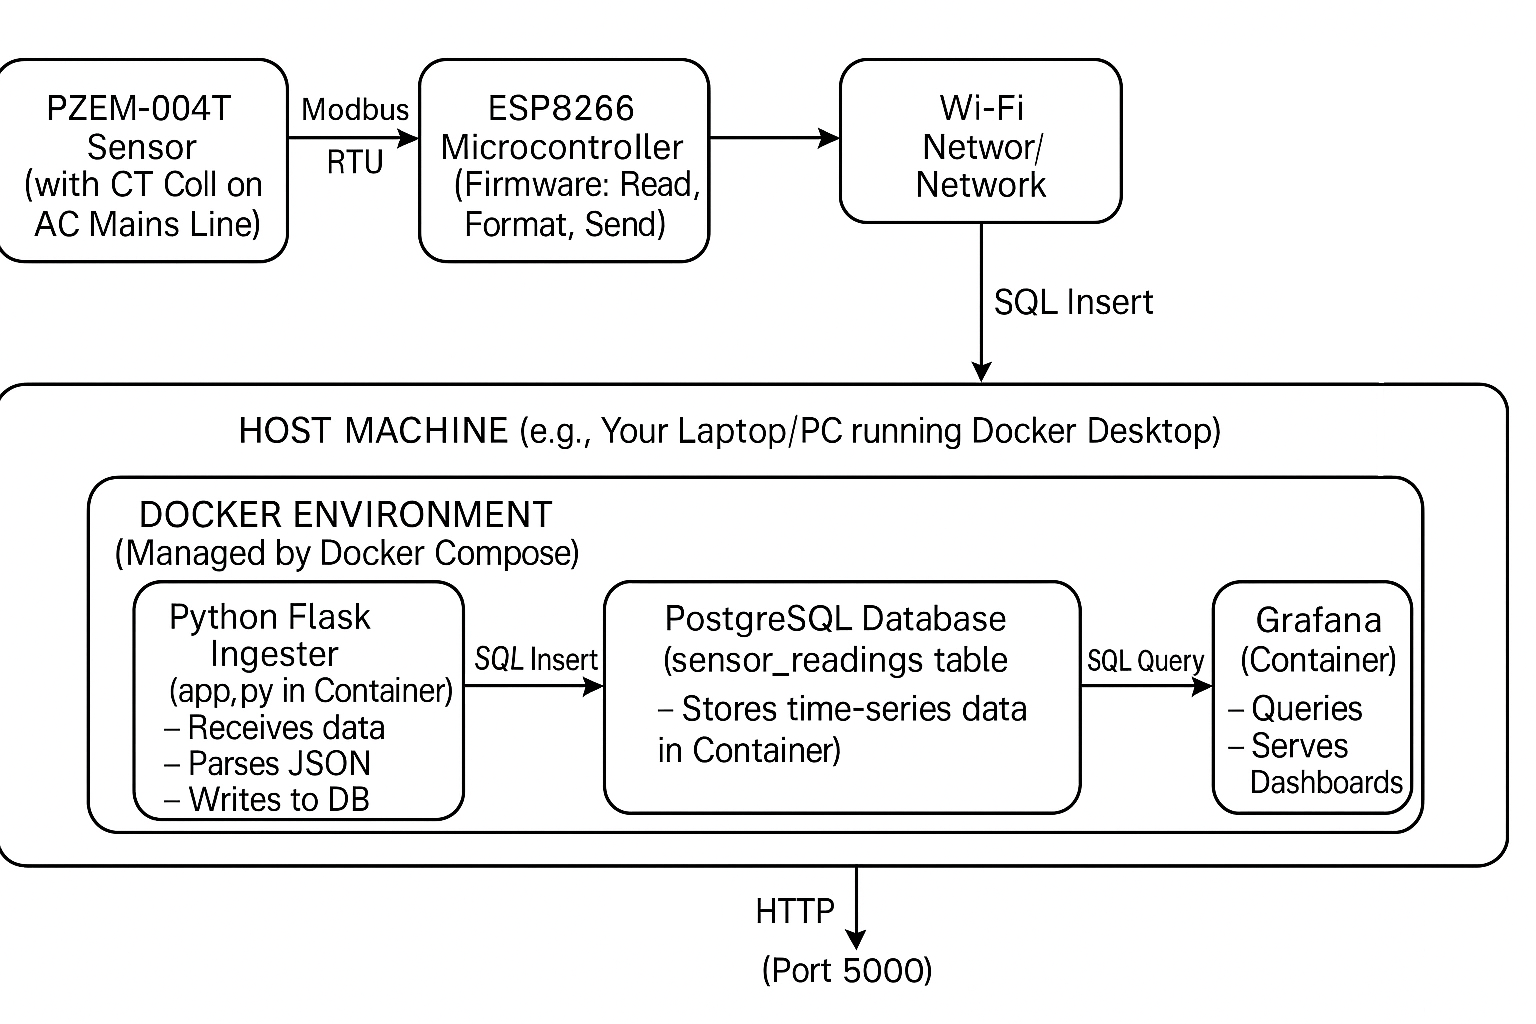
Architecture Overview
The system follows a modular architecture:
- Sensor Node (ESP8266 + PZEM-004T): The PZEM-004T measures electrical parameters. The ESP8266 reads this data via Modbus RTU (SoftwareSerial) and transmits it as a JSON payload over Wi-Fi using HTTP POST requests.
- Data Ingester (Python Flask App): A lightweight Flask application, running in a Docker container, listens for incoming data from the ESP8266, validates it, and inserts it into the database.
- Database (PostgreSQL): A PostgreSQL database, also containerized, stores the time-series energy readings. Its robust nature is ideal for handling structured data and time-based queries.
- Visualization (Grafana): Grafana, running in its own Docker container, connects to the PostgreSQL database to query and display the data in customizable dashboards featuring graphs, stats, and gauges.
- Orchestration (Docker Compose): The entire backend (Flask app, PostgreSQL, Grafana) is defined and managed by a `docker-compose.yml` file, simplifying setup and ensuring services can communicate.
Hardware Setup & ESP8266 Firmware
The core of the data acquisition involves an ESP8266 microcontroller (like a NodeMCU or Wemos D1 Mini) interfaced with a PZEM-004T v3.0/v4.0 (Modbus version) energy sensor.
⚠️ Safety First! Working with mains voltage (220-240V AC) is dangerous. Ensure you understand electrical safety practices or consult a qualified electrician before attempting any wiring.
The PZEM-004T's TX/RX pins are connected to the ESP8266's GPIO pins configured for SoftwareSerial communication. The ESP8266 firmware, written in C++ using the Arduino framework, handles:
- Initializing SoftwareSerial for Modbus communication.
- Using the ModbusMaster library to read input registers from the PZEM-004T.
- Parsing the raw register data into meaningful values (Voltage, Current, etc.).
- Connecting to Wi-Fi.
- Constructing a JSON payload with the sensor data.
- Sending the JSON payload via an HTTP POST request to the Python ingester application.
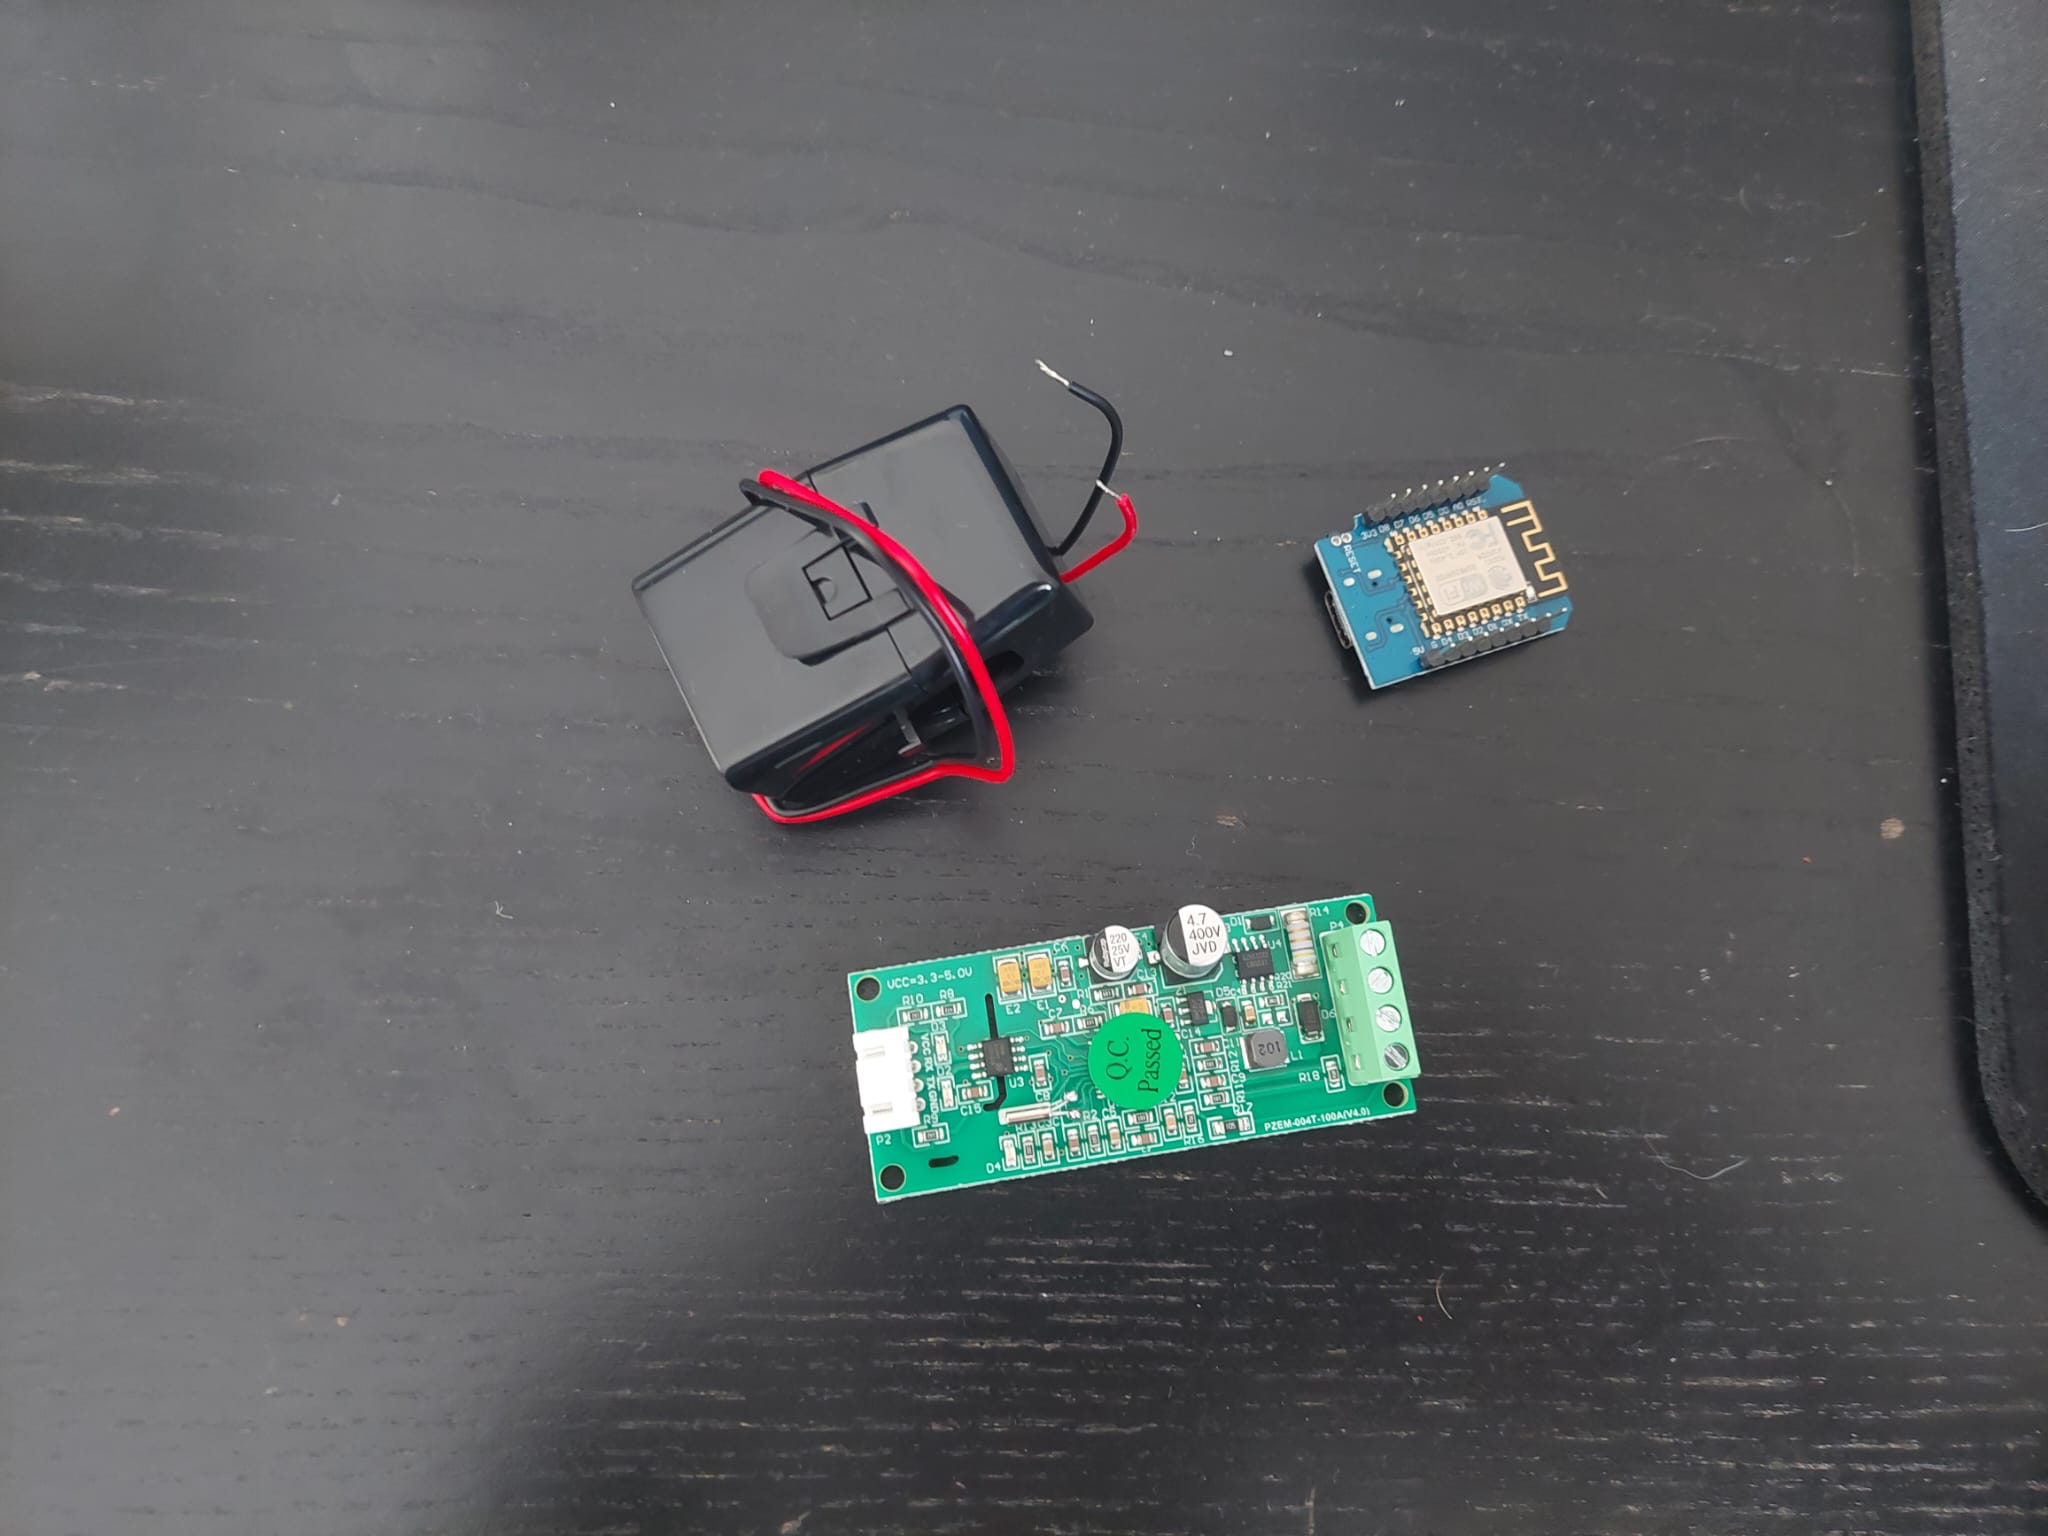
ESP8266 and PZEM-004T
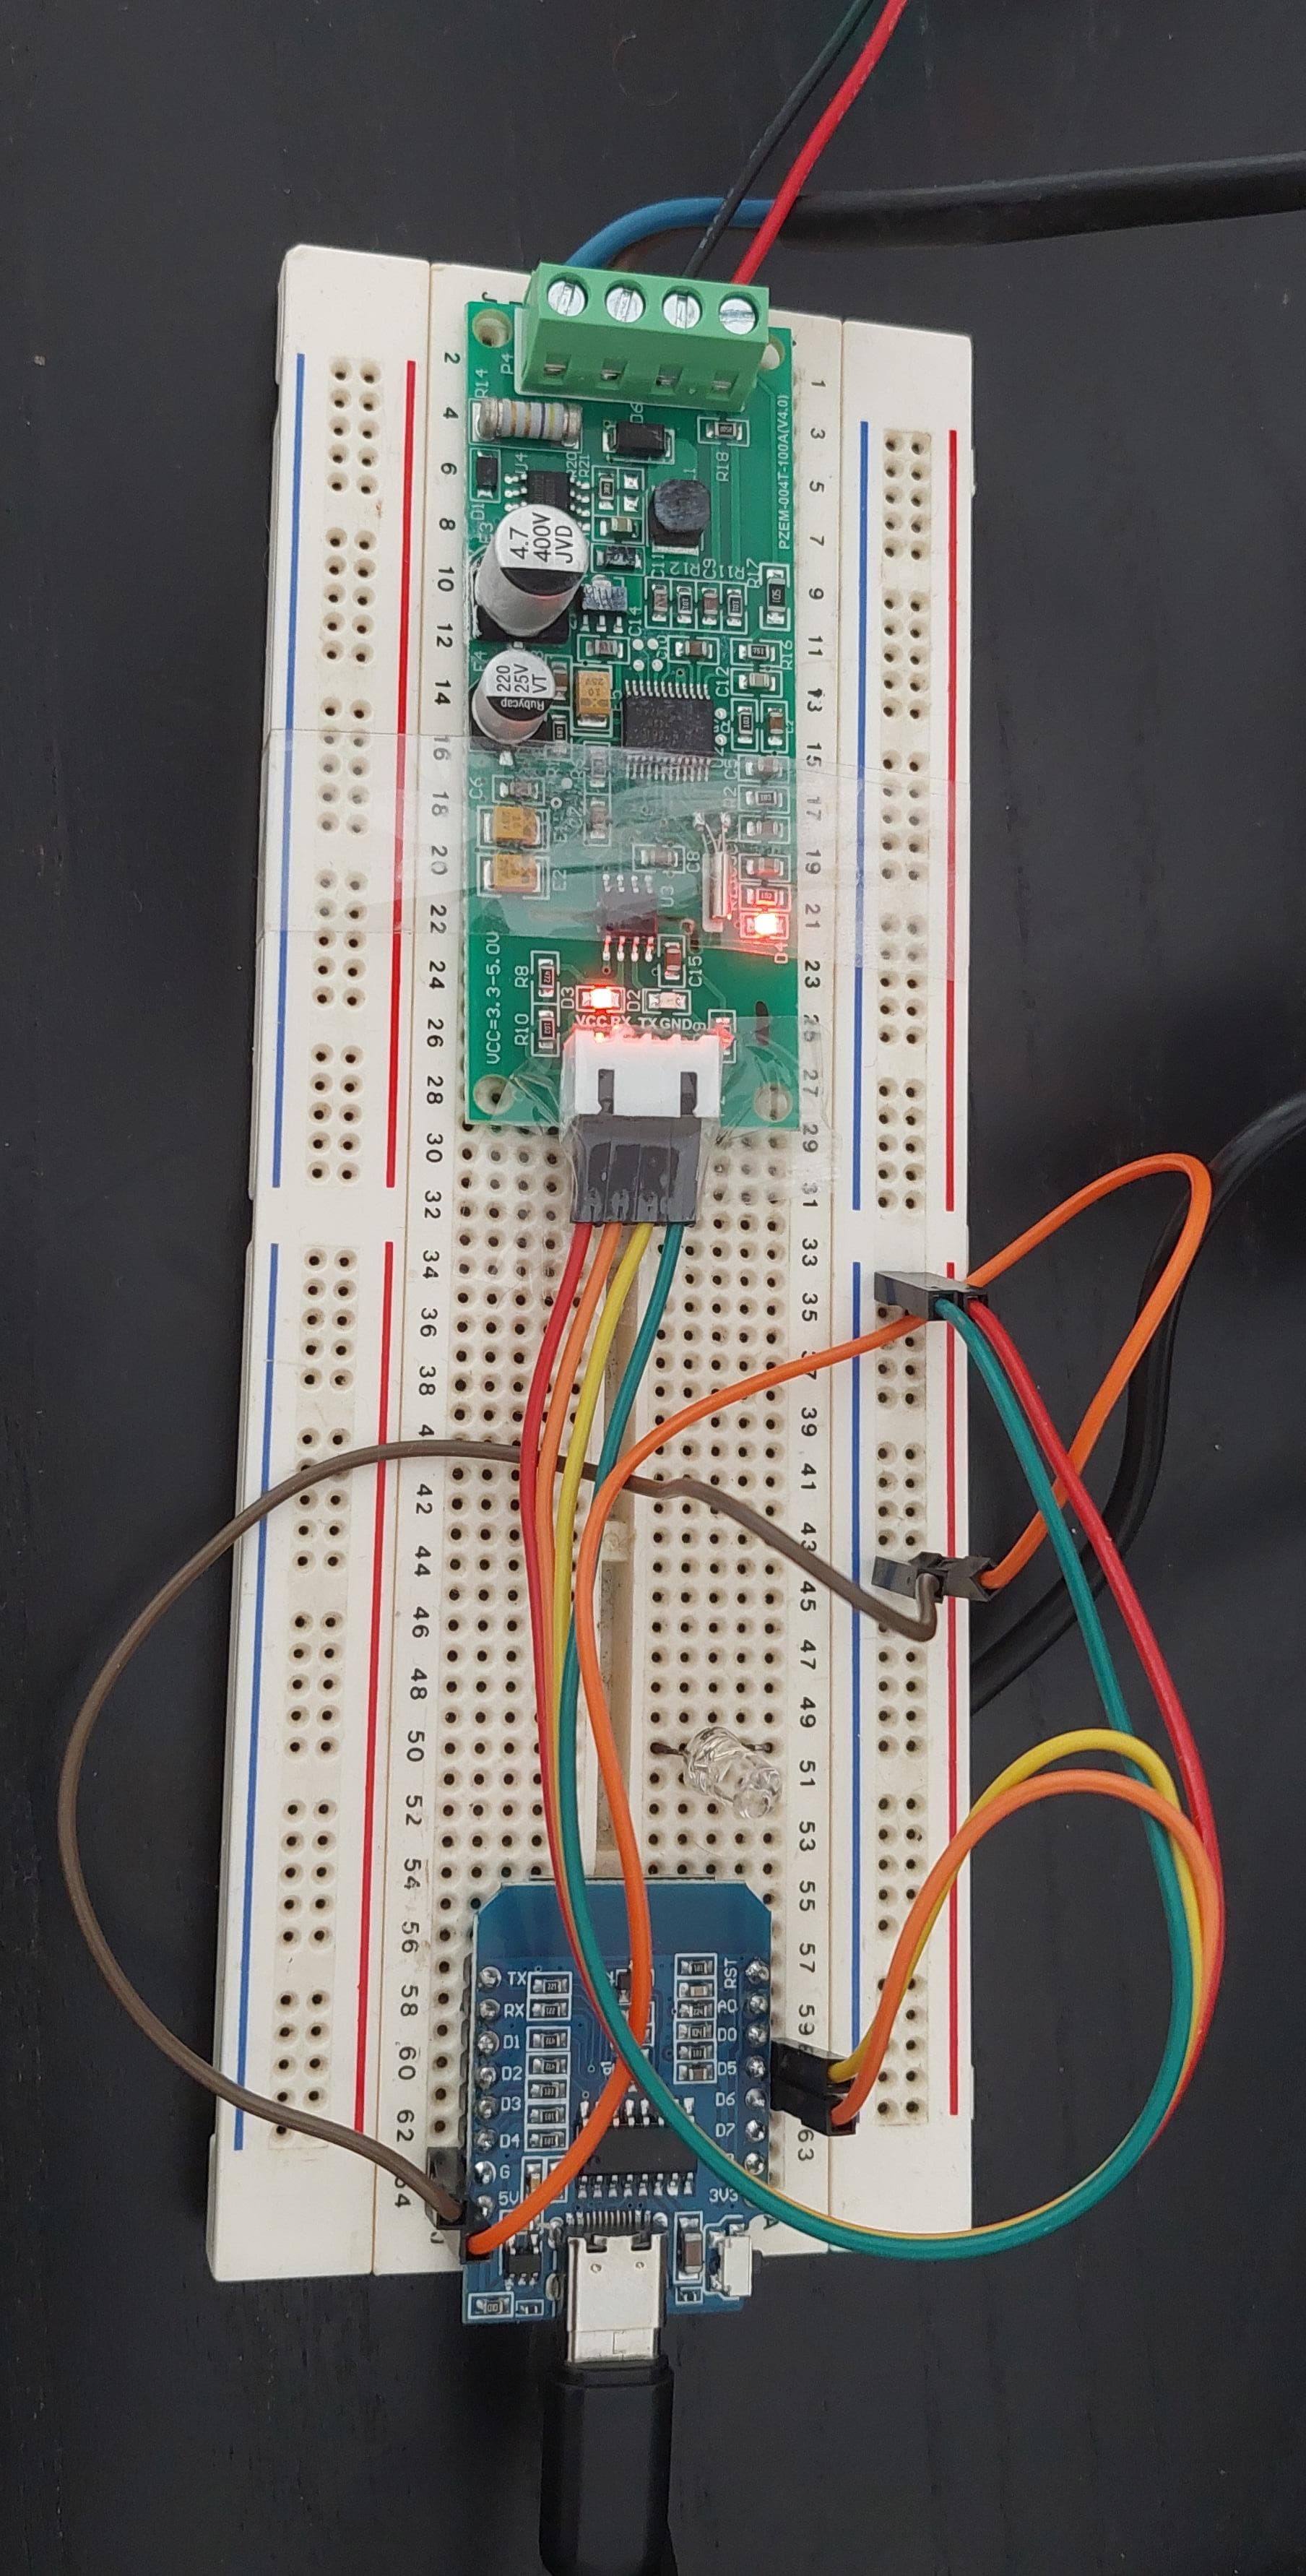
ESP8266 wired to PZEM-004T
Data Pipeline: Python, PostgreSQL, Docker
Once the ESP8266 sends data, it enters our Dockerized backend:
Python Flask Ingester: A simple Flask web server exposes an HTTP endpoint (e.g., `/data`). When a POST request with JSON data arrives, the application:
- Parses the JSON payload.
- Performs basic validation (e.g., checks for required fields).
- Connects to the PostgreSQL database using `psycopg2`.
- Constructs and executes an SQL `INSERT` statement to store the readings in a `sensor_readings` table. This table includes a `reading_time` timestamp (with time zone) which defaults to `CURRENT_TIMESTAMP`.
PostgreSQL Database: The `sensor_readings` table is structured to efficiently store the time-series data, with columns for each metric (voltage, current, power, energy, frequency, power_factor, alarm_status) and a device ID. Indexes on `reading_time` and `device_id` help optimize query performance for Grafana.
Docker & Docker Compose: All backend services (Flask app, PostgreSQL, Grafana) are defined in a `docker-compose.yml` file. This allows for:
- Easy one-command startup (`docker-compose up --build -d`).
- Isolated environments for each service.
- Defined networking, allowing services to communicate (e.g., Flask app connects to `postgres_db` by its service name).
- Persistent data storage for PostgreSQL and Grafana using Docker volumes.
- Simplified dependency management for the Python app through its `Dockerfile` and `requirements.txt`.
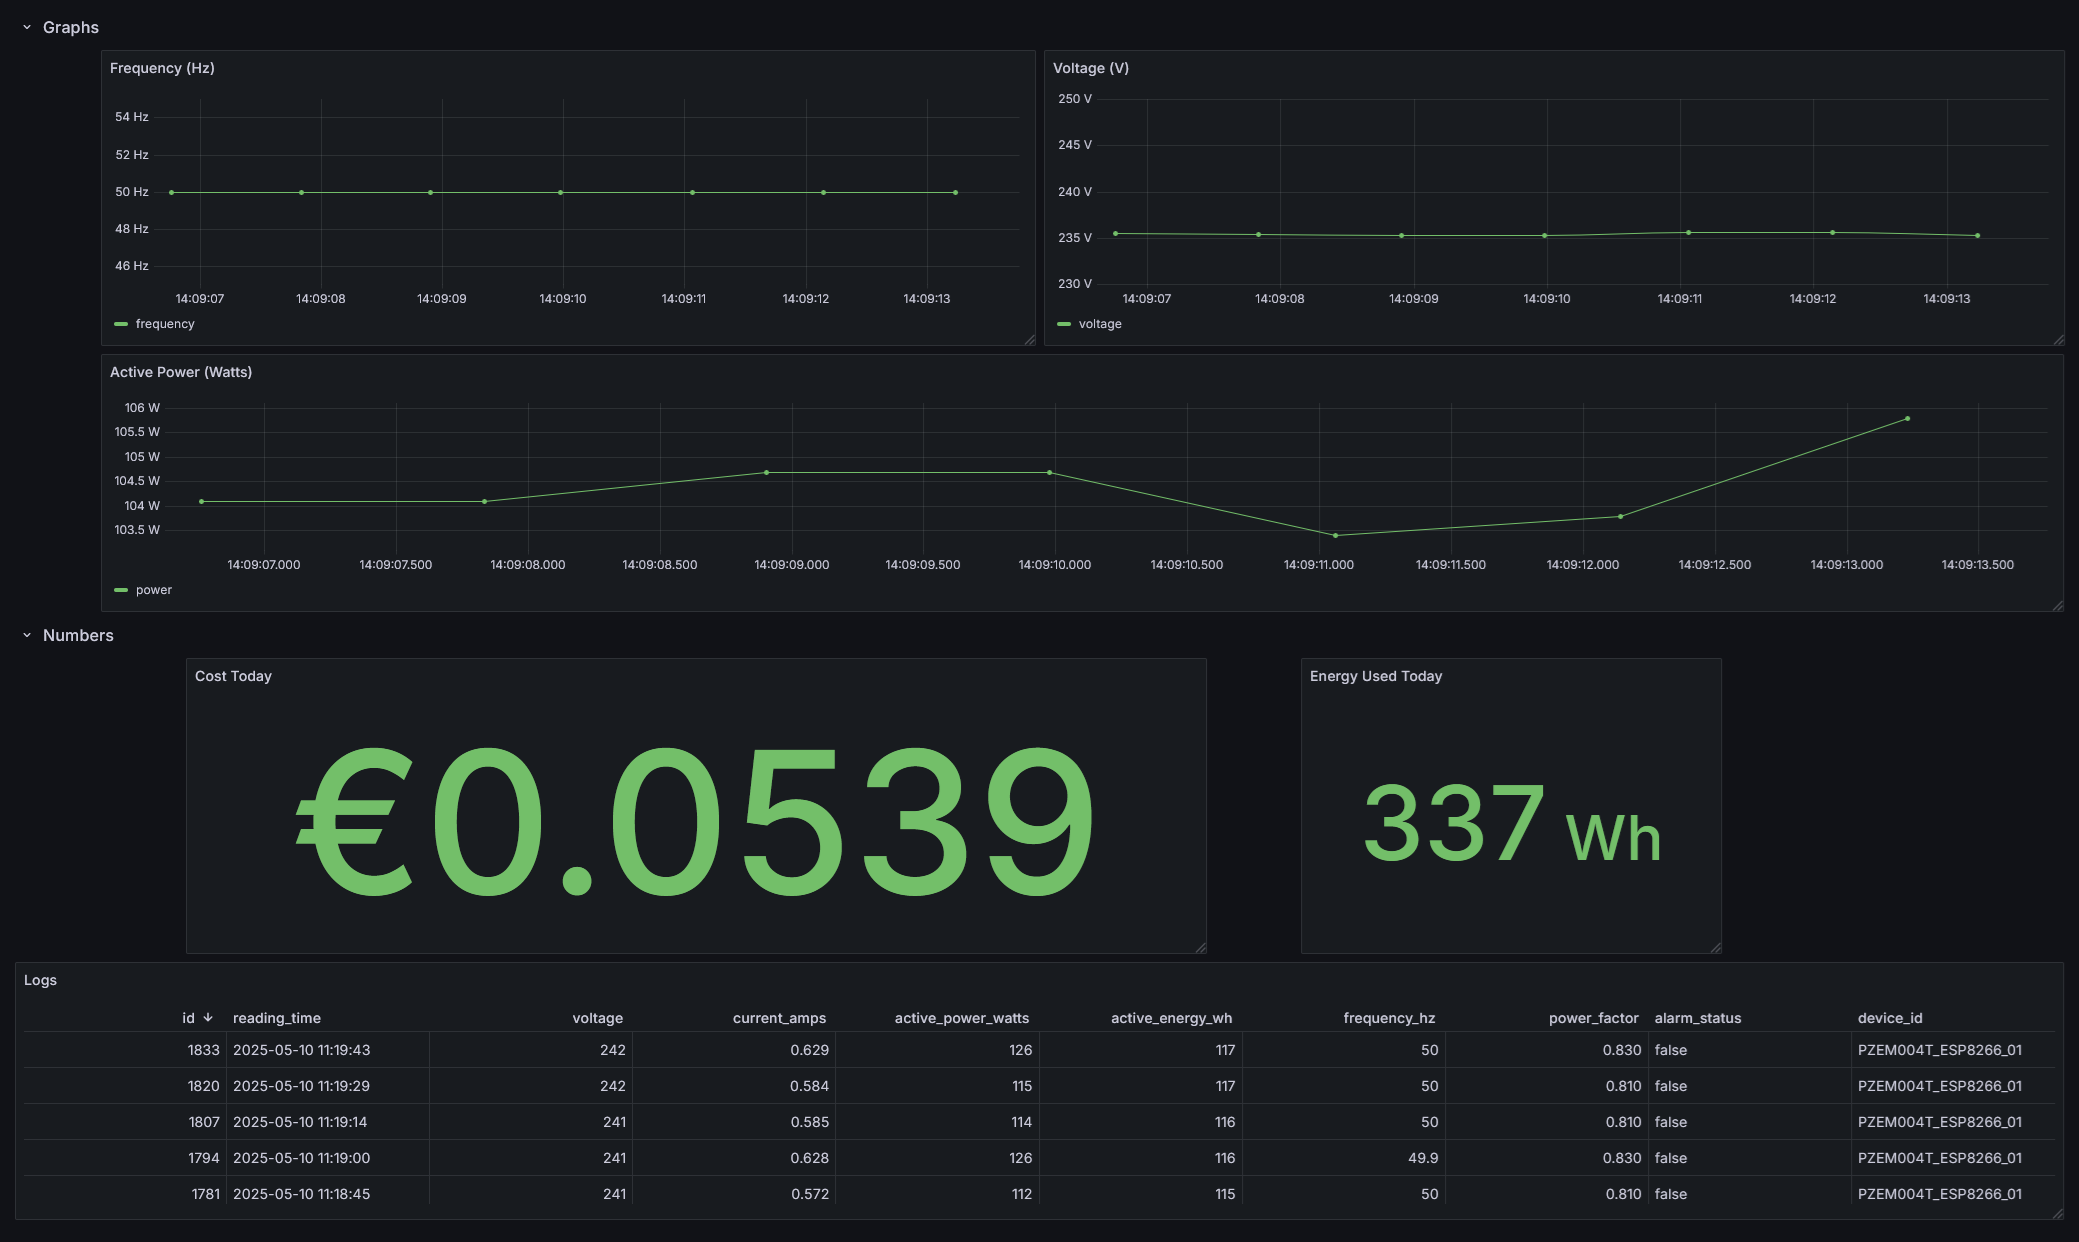
Visualization with Grafana
Grafana is the final piece, providing a powerful and flexible way to visualize the collected energy data. After setting up PostgreSQL as a data source in Grafana, dashboards are created with various panels:
- Time Series Graphs: For Voltage, Current, Active Power, Frequency, and Power Factor, showing trends over time. These heavily utilize Grafana's `$__timeFilter()` macro in SQL queries to dynamically adjust to the selected time range. Y-axis scaling is adjusted for better readability of small fluctuations.
- Stat Panels: To display current or summarized values like "Total Accumulated Energy," "Energy Used Today," and the current "Alarm Status" (with value mappings for "Normal"/"ALARM!").
- Gauge Panels: (Optional) Could be used for instantaneous power or voltage.
The dashboard is configured with auto-refresh to provide a near real-time view of energy consumption. Timezone settings are crucial for ensuring data is displayed correctly relative to the user's local time, given that the database stores timestamps in UTC.
A snapshot of the main Grafana dashboard in action.
Key Features Implemented
- End-to-end data flow from sensor to visual dashboard.
- Robust Modbus communication with the PZEM-004T.
- Containerized and easily deployable backend services using Docker Compose.
- Persistent storage of historical energy data in PostgreSQL.
- Dynamic and interactive Grafana dashboards for multiple metrics.
- Calculation of derived metrics like "Energy Used Today."
- Clear separation of concerns: data acquisition (ESP), data ingestion (Flask), storage (PostgreSQL), and visualization (Grafana).
Conclusion
This project successfully demonstrates a complete pipeline for monitoring and visualizing energy consumption. It combines embedded programming, backend development, database management, and data visualization, offering valuable insights into energy usage patterns. The use of Docker makes the entire system portable and easy to manage.
Thank you for reading! The complete source code and setup instructions are available on GitHub. I hope this project serves as a useful example or inspiration for your own IoT and data projects.
Other Projects
A NES emulator for Minix3 with custom C device drivers for timer, mouse, keyboard, graphics, and UART.
View Project
A fully functional, deployment-ready auction website built using Laravel and PostgreSQL.
View Project